EOSC 425
Contents
EOSC 425#
Official course description#
Palaeontology: Paleobiogeography in the context of plate tectonics. Mass extinction events. Fossilization and biases in the fossil record. Species concepts in paleontology. Biostratigraphy. Paleontological evidence for early life; the colonization of oceanic and terrestrial environments and; the evolution of the primates.
Links: >Home, >UBC Calendar, >ubcexplore, > EOAS curriculum map.
OCESE project objectives#
Support the increased use of quantitative Earth science concepts and data, in this case climate modeling, to support discussion about paleoclimate in this senior paleontology course.
Actions taken#
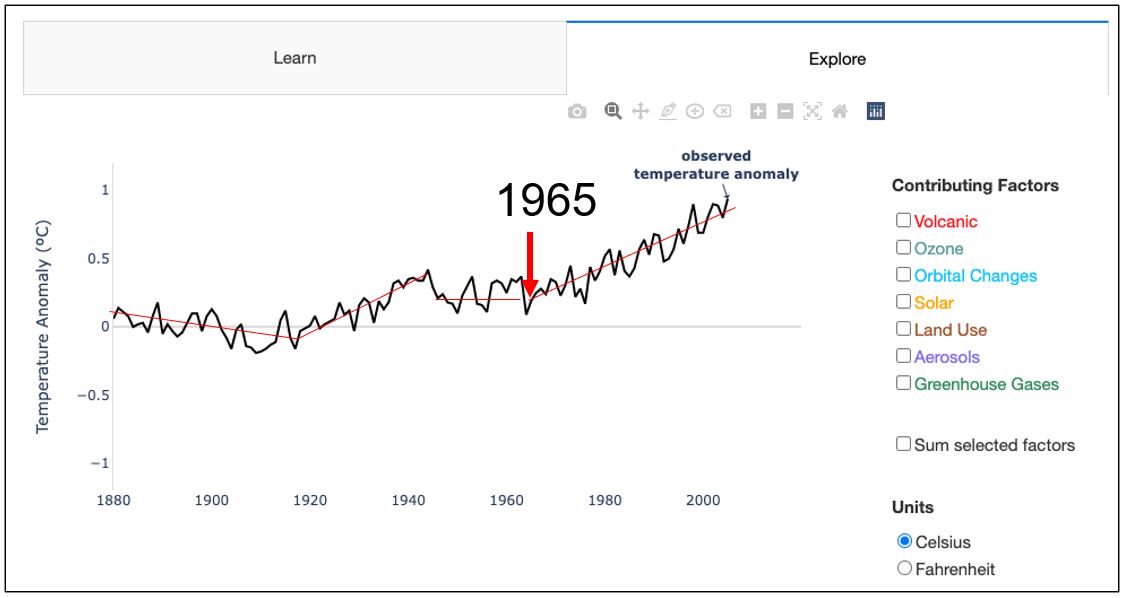
Global Temperature factors dashboard in an in-class activity, with clicker questions. Actions and questions considered in this lesson that used the dashboard include:
Use the draw tool and sketch lines that demonstrate 3 trends in temperature anomalies. What has been the annual increase in temperature anomaly between 1965 and 2005? {Requires drawing a slope, identifying end points, using arithmetic to estimate °C per year. Example of lines sketched on the dashboard’s data}
The End Permian temperature increase has been estimated at 10°C. At the rate of increase we have identified, approximately in what year will we reach a 10°C annomaly value? {Use previous result to estimate how many years to increase temperature by 10°C.}
Group discussion questions:
What issues may you have with the estimate we have calculated for 10°C temperature increase? {Issues include: “linear” assumption, natural (Permian) vs anthropogenic (now), human capacity to act (or not).}
If we do see temperatures increasing to a 10° anomaly by 2447 , should we expect a Permian level of extinction? What is different? {Issues include differences between current and permian continent configurations, climatic patterns, ocean basin geography & circulation, biosphere.}
This PDF shows the 5-slide clicker question sequence that was used in class.
Costs#
Nothing more than instructor time to develop a 10-15 minute in-class activity since the dashboard was developed for other courses.
Lessons learned#
Once a dashboard has been developed for at least one course, other instructors can leverage the facility for their own teaching purposes. If designed appropriately, any single dashboard app can be used in many settings at levels from beginner to senior.
The key is to avoid including course or activity specific details within the dashboard. Instructions must be purely “how to use the app”. Learning tasks must be delivered entirely separately. In this case - they were embedded within the instructor’s lecture slide-deck. The activity relied on ‘clickers’ and group discussions that made use of results obtained using the dashboard.