EOSC 112
Contents
EOSC 112#
Official course description#
The Fluid Earth: Atmosphere and Ocean: Introduction to processes in ocean and atmosphere. Heat, current, winds, clouds, marine life, resources. Effects of coupling, climate change, pollution.
Links: >Home, >UBC Calendar, >ubcexplore.
OCESE project objectives#
Support development, implementation and evaluation of new activities related to incorporating climate datasets and climate change science into the course. These initiative were partly funded by UBC Climate and Wellbeing Education grants.
Actions taken#
Grad students hired for this project developed ideas and then discussed options for implementation with OCESE team members.
Completed the Global Temperature dashboard used in eosc112 and several other courses.
A second dashboard (climate-mind-map) was concieved and prototyped (in HTML5, not Python), but implementation was put off for a later time.
Supported development, observed implementation, and coordianted evaulation of an activity based on the IPCC Climate Atlas for EOSC 112 (147 students). This activity was worksheet-based. Begun in class, students could work in groups or alone. Getting-started instruction were provided by lecture and instructors & TAs then circulated to ensure students were making progress. The assignment was completed at home with responses delivered to the course’s Canvas site for assessment as PDFs or scanned images.
Learning goals for the Climate Atlas in-class activity:
Describe the difference between climate SSP scenarios.
Produce climate change graphs using the interactive climate atlas, and compare them quantitatively.
Describe some impacts of climate change within your expected lifetime for different SSP scenarios.
Students’ experiences#
These feedback questions were posed to students as the last step in their assignment:
What have you learned by working on this activity?
Were you surprised by anytyhing you observed?
What is one question you have that was inspired by this activity?
Open ended responses were analyzed to find commonalities and to identify particularly thoughtful or information statements from students.
Results from student feedback about the IPCC Climate Atlas activity are summarized in a separate PDF file.
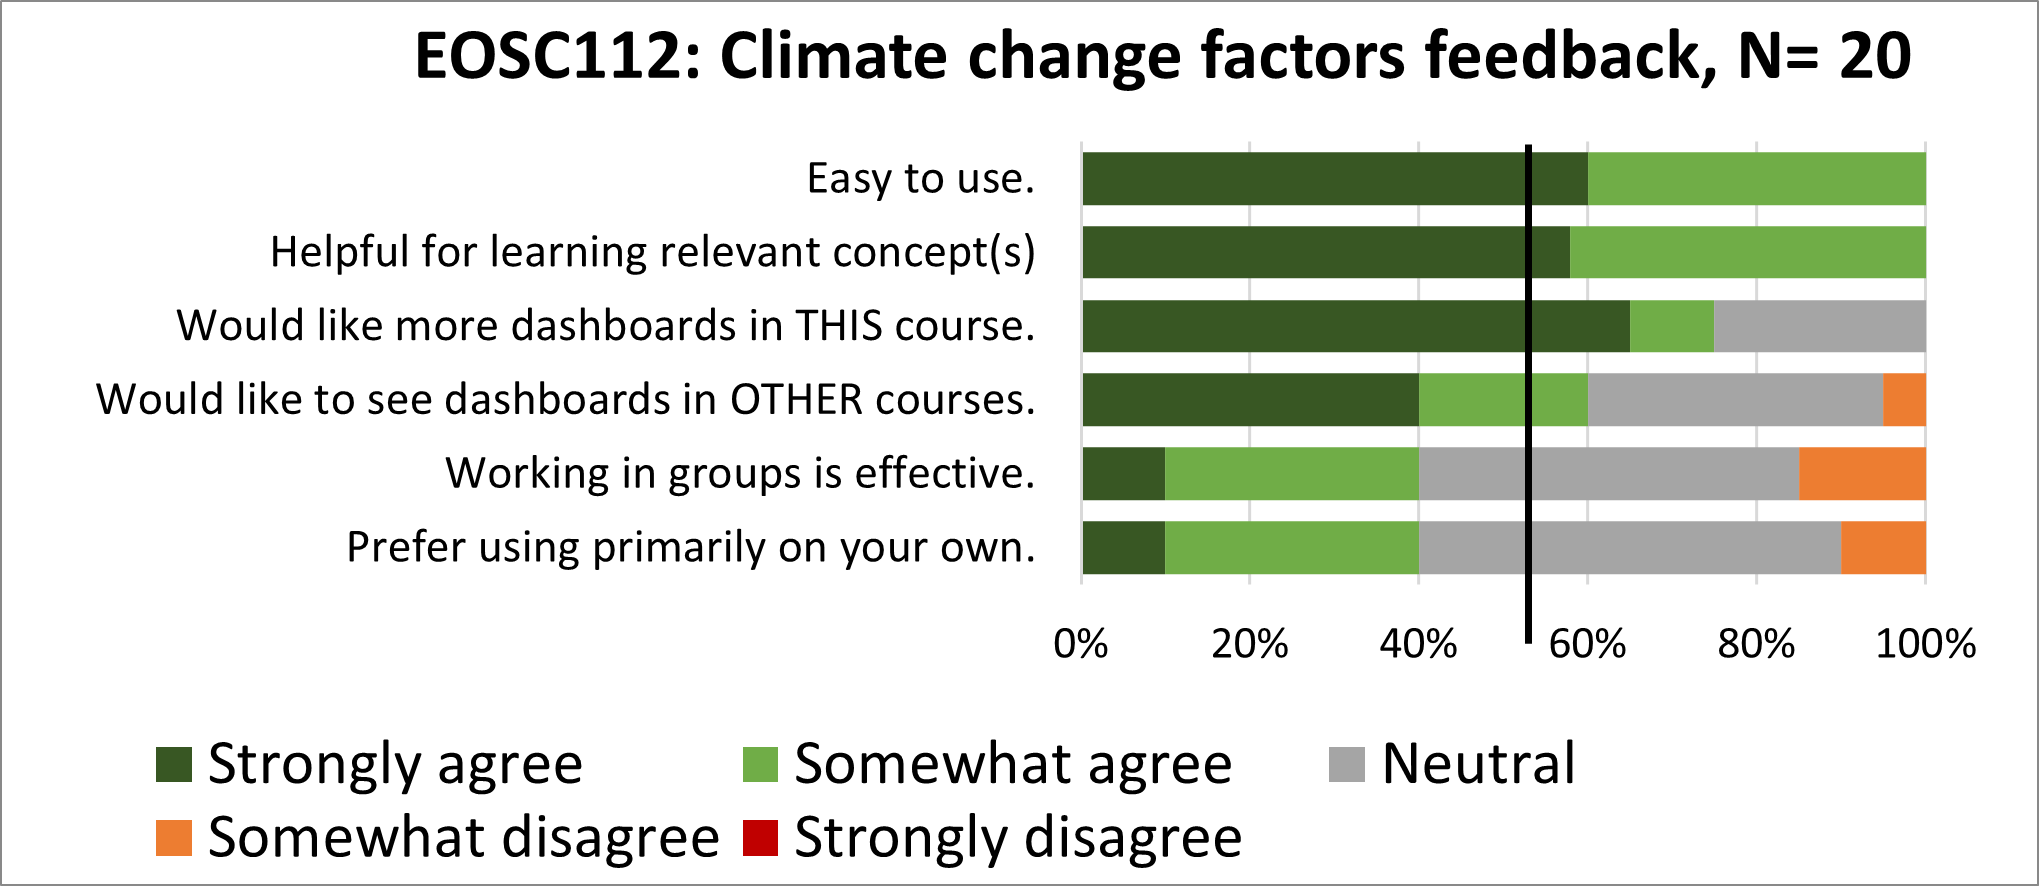
Student feedback regarding dashboard use was limited as completing the short survey was optional. Nevertheless, results in the figure below suggest the facility and its use were largely appreciated by students.
Instructors’ experiences#
No explicit feedback on instructors’ experiences was obtained.
Costs#
Much of the innovation was due to energetic graduate students, keen instructors and the fact that some funding was obtained to support development work above and beyond the time and funding of a normal teaching assistanship. OCESE contributed by consulting on learning activity design, implementation and evaluation tactics, and by building the dashboard app itself.
Lessons learned#
Leveraging the energy and enthusiasm of graduate students is always rewarding.