EOSC 325
Contents
EOSC 325#
Official course description#
Principles of Physical Hydrogeology: Theories of storage and movement of water within groundwater systems; Groundwater-surface water interaction; Role of groundwater systems in watershed management and regulating the environmental impacts of global change; Groundwater sustainability; Impacts of climate & land use changes on groundwater resources.
Links: >Home, >UBC Calendar, >ubcexplore, > EOAS curriculum map.
OCESE project objectives#
Introduce interactive dashboard apps to classroom and assignment activities to explore specific hydrogeologic concepts, models, and data sets.
Convert question sets for efficient upload to the new course’s Canvas website.
Provide geoscience education feedback on lessons for this brand new course.
Actions taken#
Dashboard design#
Storativity: compares hydrological storativity of various geologic materials. Github repository is the “store” folder here.
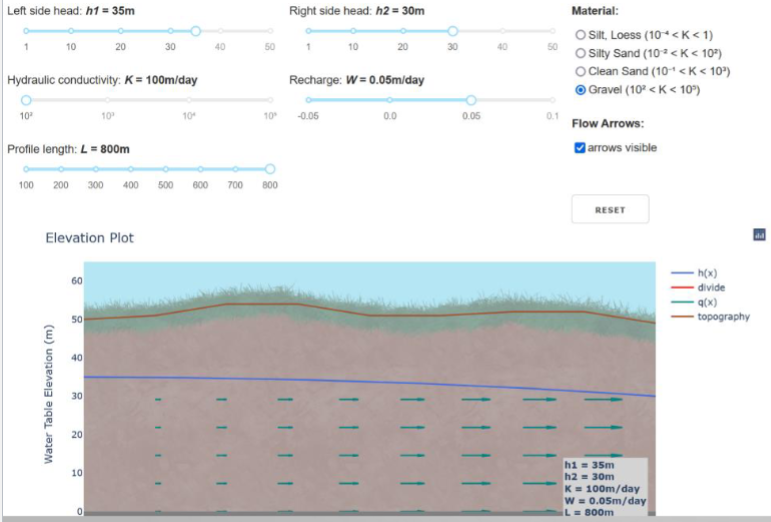
Unconfined-flow: an interactive model of linar (“1D”) groundwater flow in an unconfined acquifer between two sources, with surface recharge included. Github repository is the “hydro” folder here.
Drawdown for confined and unconfined acquifers plots 2D drawdown curves for a well in a uniform acquifer with adjustable properties. Github repository is the “drawdown” folder here.
Pedagogy#
Storativity app: first used by posing three questions to be addressed using the interactive dashboard app (slide 56 of section 7).
Which soil material has the largest storativity in a confined aquifer (use the max values)?
Which soil material has the largest storativity in an unconfined aquifer?
Which soil material has the largest difference in storativity between unconfined and confined aquifers?
Unconfined flow app was first used by posing two group-discussion questions to be addressed using the interactive dashboard app (slide 48 of section 8).
Set hydraulic conductivity: K = 10m/day (Silty Sand).
First set hydraulic conductivity: K = 50 m/day (Clean Sand).
Compare flow behaviour if you change hydraulic conductivity to K = 100 m/day (Gravel).
By exploring visuals for these conditions consider these 2 questions:
What happens to the water divide? Discuss your answer mathematically and conceptually.
What happens to the ranges of Q values? Discuss your answer.
Drawdown app: The concepts are addressed in the course, the app is desired by the instructor, and it is ready for use (links above). Unfortunately, the pacing of this brand new course, and continued challenge of running a new course in a temporary online form (due to COVID) meant time ran out this term.
Transfering question sets from prior use: questions were first converted from various formats (PDF, MS-Word, text files, etc.) to Markdown text, then text2qti was used to upload to the courses’s Canvas site. See our assessment page for tips.
Students’ experiences#
Students were observed to be fully engaged during an activity that involves exploring a concept or physical process by adjusting parameters with “instant” response in graphical form.
Quotes from feedback based on a 3rd party (online) class observation:
Re. Storativity app: “The activity seemed a bit rushed. That can be mitigated by suggesting that students explore the dashboard before coming to class. Maybe give them the URL, say “play with this” and suggest they come to class with 1 question, and 1 observation. That second could be posed as a specific question such as “find out which material has the largest storativity under conditions of x, y, z”.
Re. Unconfined flow app:
“Sequence of clicker questions about boundaries was great”.
“I like how parameters discussed earlier in lecture were related to the dashboard. Making the connection between abstract (lecture) and practical (activity) is often challenging for students”.
“The two-step activity that depends on the app seems well designed”.
General feedback about using dashboards in lessons:
See general guidelines for teaching with dashboards on our Teaching with Dashboards page.
Questions to solve might be more “interesting” if they are in terms of the consequences to people or property. Examples:
“Which water body will receive the agricultural pollution when the divide migrates due to changing recharge?”
“Under what conditions will water table become higher than ground thus contributing to flooding?” Or - if you ask “what happens to range of Q values?”,
Then follow up by asking something concrete about the consequences for influx of groundwater at the two sides of the scenario - eg. which waterway will have to handle the larger input of water?
These are just ideas about connecting concepts to reality. It is fair to say that these ideas may not be compatible with an instructor’s priorities.
Instructors’ experiences#
Developing this new course from scratch was of course time consuming. Introduction of interactive dashboards was not an initial priority. However OCESE support did include reviewing the lessons, and supporting use of opensource techniques for transferring questions and question banks from text or PDF documents to the Canvas learning management system.
Dashboards were planned for use quite late in the course. Consquently, when the first iteration of the course took longer than expected, dashboards were reduced to relatively perfunctory use as in-class group activities. See lessons learned below.
The second time the course was offered, dashboards were used more carefully without being rushed.
Costs#
Time spent supporting this course was uniquely related to it being a brand new course. Addressing specific OCESE project goals could not be done without providing course development support more broadly. This was entirely reasonable and feasible given that OCESE team included geoscience teaching and learning specialist. The instructor’s interest in such support and willingness to spend time discussing, and reacting to feedback, was instrumental in the successfull development of the course and the specific OCESE contributions.
Lessons learned#
Students do need time for familiarization with new tools. This is best done by using “simple” apps early in the course, then applying those skills later in the course with the same, or similar dashboards.
Instructors do need time to establish an efficient and effective workflow of learning tasks to guide students and ensure they get as much out of the experiences as possible.